
Glycemic index and blood sugar: what the numbers can tell you
Also known as GI, glycemic load, and blood glucose.
Editorial draft Last reviewed 8 November 2026 About 1181 words
Everyday exposure includes starch, not just sweetness
White bread, rice, potatoes and breakfast cereals can produce substantial blood-glucose responses even when they do not taste especially sweet. Glycemic index, or GI, compares responses to carbohydrate-containing foods under standardized testing conditions. It offers a way to examine a less visible part of everyday eating, but it does not label a food as poisonous, diagnose diabetes or replace a balanced diet. [1–3]
The amount eaten also matters. A low-GI food can supply a large carbohydrate dose, while a small portion of a higher-GI food may supply relatively little. The University of Sydney's GI guidance therefore distinguishes GI from glycemic load, or GL. Confusing these measures can turn a useful comparison tool into a misleading list of foods to fear. [2]
Known and suspected harms: what needs careful wording
Established: insulin resistance means cells respond poorly to insulin; when the pancreas cannot compensate sufficiently, blood glucose rises. Persistent abnormal glucose regulation and prediabetes warrant proper clinical assessment. Prediabetes often has no symptoms, and laboratory tests—not a subjective feeling after lunch—are used to identify it. [4]
Possible, with causal uncertainty: repeated high-GI eating may be relevant to metabolic risk, but a post-meal rise alone does not establish that a food has caused insulin resistance. The Sydney material describes the rationale for lower-GI choices; NIDDK identifies several contributors to insulin resistance and says its causes are not fully understood. These sources do not establish that each ordinary “spike” progressively damages an otherwise healthy person's pancreas. That stronger claim is not justified here. [1,2,4]
These are editorial evidence labels, not a formal clinical grading system. Our aim is to document a real concern—long-term glucose dysregulation—without treating every temporary rise as the same condition or suggesting that everyone needs a glucose monitor. [4]
What GI actually measures
In the standardized method described by the Sydney GI group, volunteers eat a food portion supplying 50 grams of available carbohydrate, and their blood-glucose response is followed over two hours. The response is compared with a reference food, usually glucose, and testing involves at least ten people. GI reflects the relative area under the glucose-response curve, not simply the highest single glucose reading. [1]
On the glucose-reference scale, low GI is 55 or below, medium is 56–69, and high is 70 or above. Glucose is assigned 100; the database includes some results above 100, so it should not be described as a scale mathematically capped there. The test fixes carbohydrate quantity, not food weight: 50 grams of carbohydrate is not the same as 50 grams of bread or rice. [1,3]
GI is a measured property of a tested food under particular conditions. A value for one cultivar, recipe or processing method does not certify every similarly named item. The database includes different results for breads, rice and potatoes, and preparation details matter. “Wholegrain” and “brown” can be useful descriptions of a food, but neither guarantees a low GI. [2,3]
High-GI examples beside lower-GI alternatives
The following are selected tested foods, not universal category averages. Values and study details come from Sydney's searchable database. Pairings suggest ways to vary meals; they are not head-to-head clinical trials, equal-calorie substitutions or guarantees about supermarket products today. [3]
| Higher-GI tested example | GI; test context | Lower-GI example to consider | GI; test context |
|---|---|---|---|
| White Lebanese bread, Seda Bakery | 75; Australia, 2002 | Organic Heavy Wholegrain bread, Golden Hearth | 53; Australia, 2004 |
| White Thai Hom Mali fragrant rice, rice-cooker cooked | 96; Singapore, 2013 | Whole-grain Celebrity barley, boiled 25 minutes | 21; Canada, 2012 |
| Potatoes, unspecified variety, baked 30 minutes | 78; South Korea, 2018 | Lentils, boiled in salted water | 29; Canada, 1981 |
| Cornflakes | 74; China, 2005 | Porridge oats | 55; China, 2005 |
The bread entries are database records of unpublished Sydney research. The rice entry cites Sun and colleagues; the barley entry cites Aldughpassi and colleagues; the potato entry cites Kim and colleagues; the lentil entry cites Jenkins and colleagues; the Chinese cereal entries cite Yang and colleagues. Several are older tests, and some small studies used fewer participants than the modern method described above. This limits how confidently they predict a current product's response. [3]
Sydney also lists cornflakes with lower values in other tests and a wide range for rice and potatoes. That variation is the point: use the specific record and context, not a single dramatic number selected to condemn an entire food category. Barley or lentils may replace part of a starch portion, but their texture, nutrients and cooking uses differ from bread or potatoes. [2,3]
Glycemic load brings the portion back in
The formula is GL = GI × grams of available carbohydrate in the portion ÷ 100. Sydney gives an apple example with GI 40 and 15 grams of carbohydrate: GL is 6. Its potato example uses GI 80 with the same carbohydrate amount: GL is 12. These are worked examples, not fixed measurements of every apple or potato. [2]
An additional arithmetic illustration makes the portion issue clear: GI 40 with 30 grams of available carbohydrate also gives GL 12. Doubling the carbohydrate portion doubled the calculated load even though GI stayed unchanged. That does not prove that the two meals will produce identical glucose curves in every person. It shows why GI alone leaves out an important part of the exposure. [2]
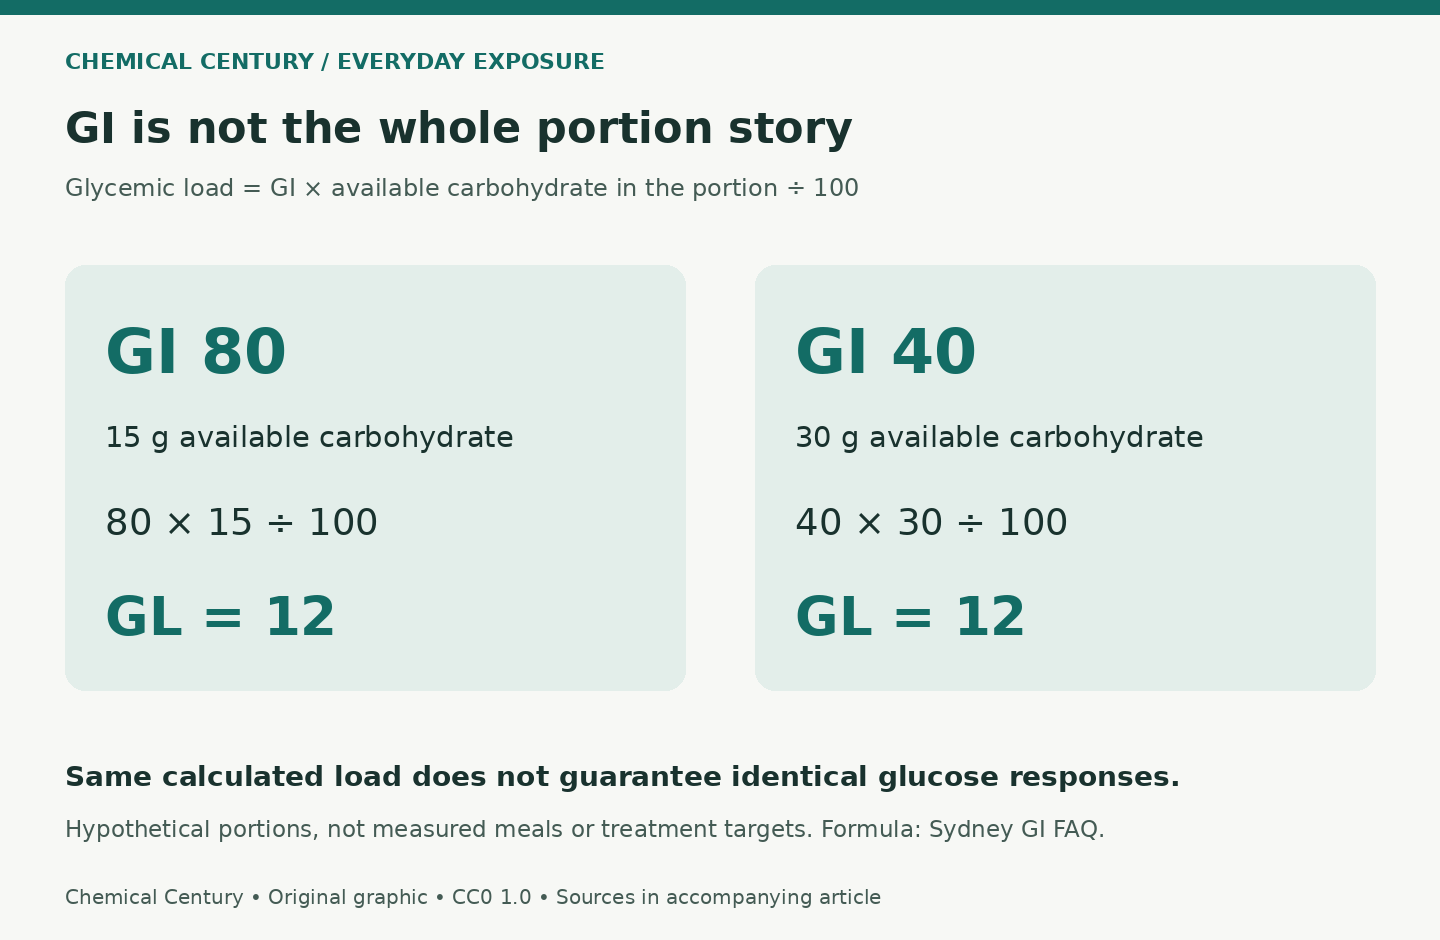
Illustrative arithmetic, not measured meals or medical targets.
Credit: Chemical Century; original diagram
License: CC0 1.0
Why a mixed meal and a person are not a test tube
Protein, fat, fibre and food structure can alter digestion and the response to a mixed meal. Sydney notes that some high-fat foods have low GI, so low GI is not an all-purpose health score. Finely milled wholemeal bread can behave differently from bread containing more intact grains. Adding fat merely to lower a glucose response is not automatically a nutritional improvement. [2]
Insulin resistance also involves more than the carbohydrate in one meal. NIDDK lists inactivity, excess body weight, family history, age, gestational diabetes, polycystic ovary syndrome, sleep apnea and certain medicines among relevant factors. A person can need assessment even without noticing symptoms; conversely, a normal post-meal change is not enough to diagnose disease. [4]
Practical choices without chasing a perfectly flat curve
Consider replacing some refined starch with legumes, barley or a tested lower-GI option; check portions and the overall meal rather than searching for the lowest number in isolation. Keep in mind that rice varieties, bread recipes and preparation methods differ. A database entry is a starting point, not a personalised meal plan. [2,3]
For someone with diabetes or suspected prediabetes, food changes should fit professional advice and prescribed treatment. NIDDK supports healthy eating, physical activity, adequate sleep and weight management when appropriate. The evidence-based objective is better long-term health and glucose regulation—not fear of every food or a promise that one lower-GI swap prevents diabetes. [4]
Sources
Fetched 2026-11-08. Selected database rows are also retained in research/gi-selected-rows.json.
- University of Sydney GI group: About GI.
- University of Sydney GI group: Frequently asked questions.
- University of Sydney: GI searchable database. Original study citations and test details are displayed with the entries.
- NIDDK: Insulin Resistance and Prediabetes.